Fact Sheet
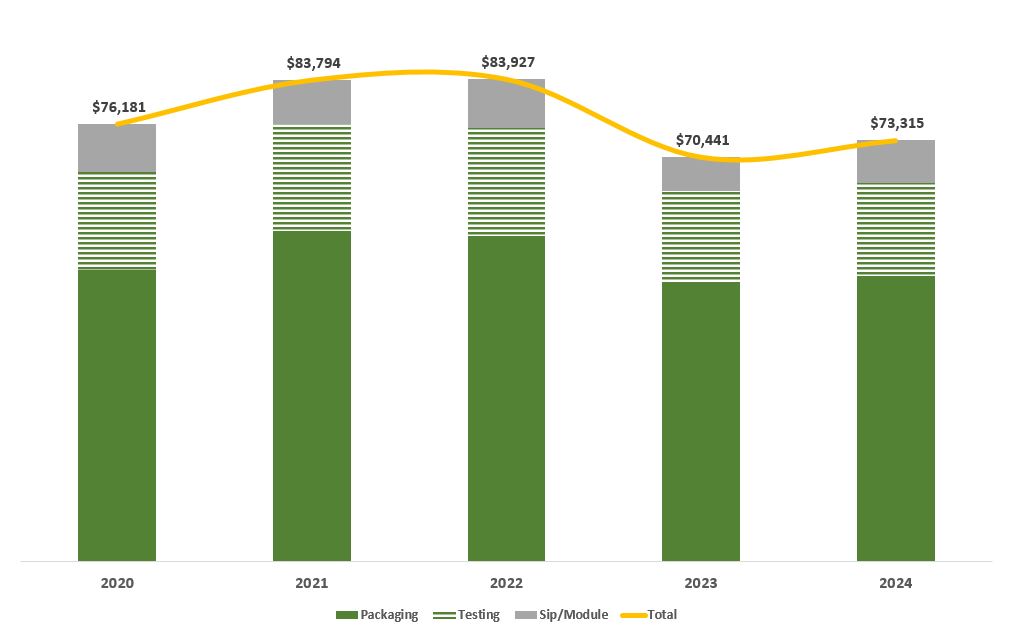
Consolidated Revenue by Service (NT$ M)

-
Amount
%
-
Amount
%
-
Amount
%
-
Amount
%
-
Amount
%
- Packaging
-
50,746
67%
-
57,597
69%
-
56,646
67%
-
48,616
69%
-
49,646
68%
- Testing
-
17,082
22%
-
18,523
22%
-
18,825
23%
-
15,860
23%
-
16,250
22%
- SiP/Module
-
8,353
11%
-
7,674
9%
-
8,456
10%
-
5,966
8%
-
7,419
10%
- Revenue Total
-
76,181
100%
-
83,794
100%
-
83,927
100%
-
70,441
100%
-
73,315
100%
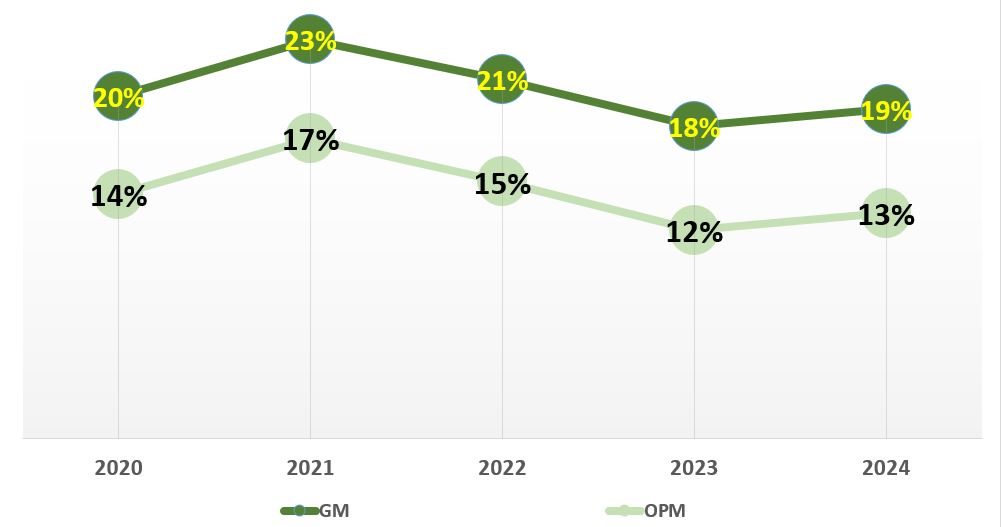
GM、OPM

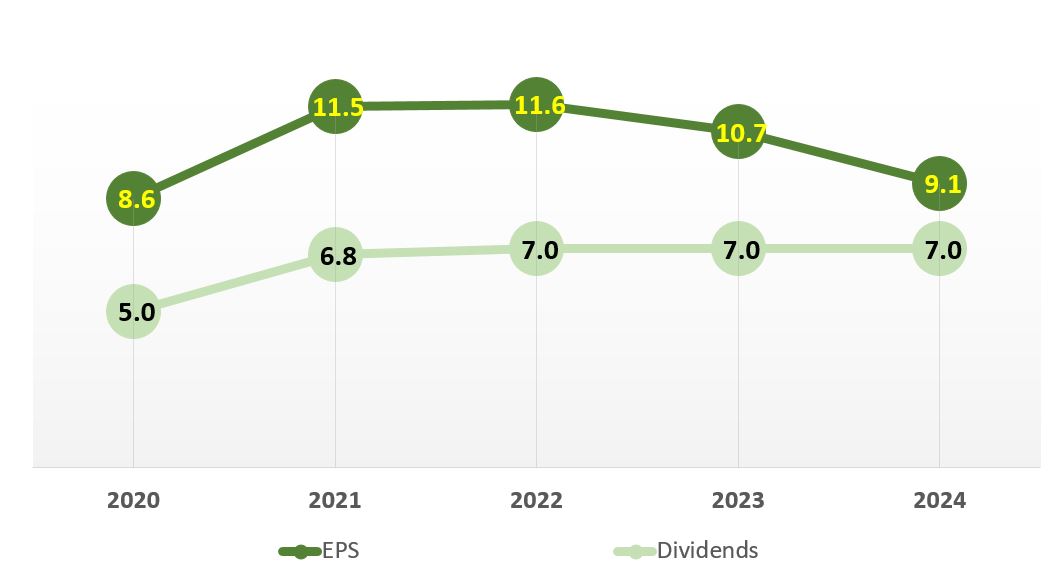
EPS, Dividends (NT$/Share)
